Method Comparison
Use gene_calling_benchmark.compare_multiple_predictions() when you
already have aggregated benchmark results for several methods and want a common
plot bundle.
Workflow
from pathlib import Path

from gene_calling_benchmark import (
    BEND_LABEL_CONFIG,
    EvalMetrics,
    benchmark_from_arrays,
    compare_multiple_predictions,
)

metrics = [
    EvalMetrics.INDEL,
    EvalMetrics.REGION_DISCOVERY,
    EvalMetrics.BOUNDARY_EXACTNESS,
    EvalMetrics.NUCLEOTIDE_CLASSIFICATION,
    EvalMetrics.STRUCTURAL_COHERENCE,
]

all_results = {
    "segmentnt": benchmark_from_arrays(
        gt_labels=gt_arrays,
        pred_labels=segmentnt_arrays,
        label_config=BEND_LABEL_CONFIG,
        metrics=metrics,
        infer_introns=True,
    ),
    "augustus": benchmark_from_arrays(
        gt_labels=gt_arrays,
        pred_labels=augustus_arrays,
        label_config=BEND_LABEL_CONFIG,
        metrics=metrics,
        infer_introns=True,
    ),
}

figures = compare_multiple_predictions(
    per_method_benchmark_res=all_results,
    label_config=BEND_LABEL_CONFIG,
    metrics_to_eval=metrics,
    output_dir=Path("plots/comparison"),
)
Result Inputs
compare_multiple_predictions(...) accepts either:
raw outputs from
gene_calling_benchmark.benchmark_from_arrays()pipeline outputs from
gene_calling_benchmark.benchmark_from_gff()where each method result is wrapped as{"aggregated": ..., "global": ...}
For the second case, the plotting code automatically unwraps the
aggregated section.
Example Output
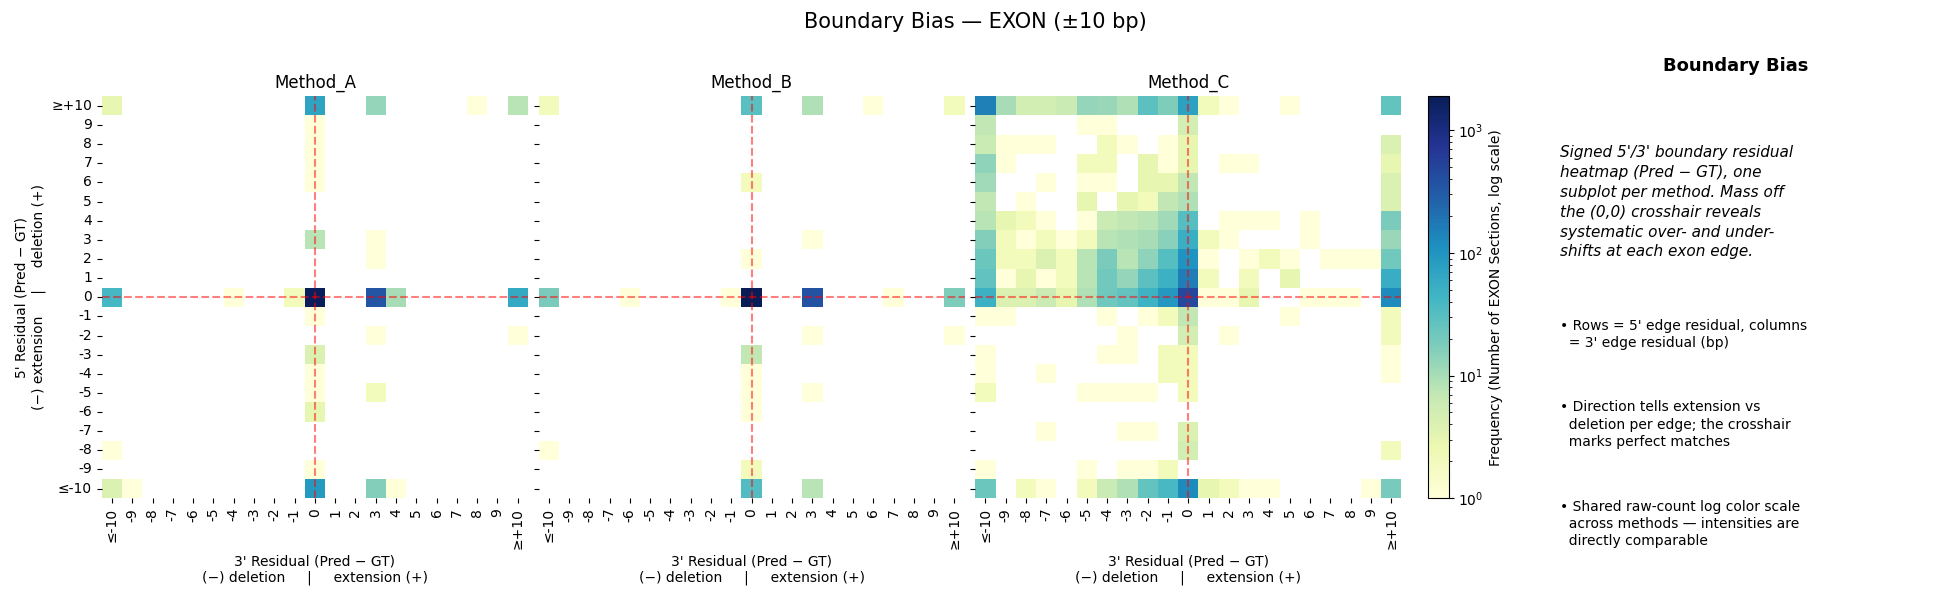
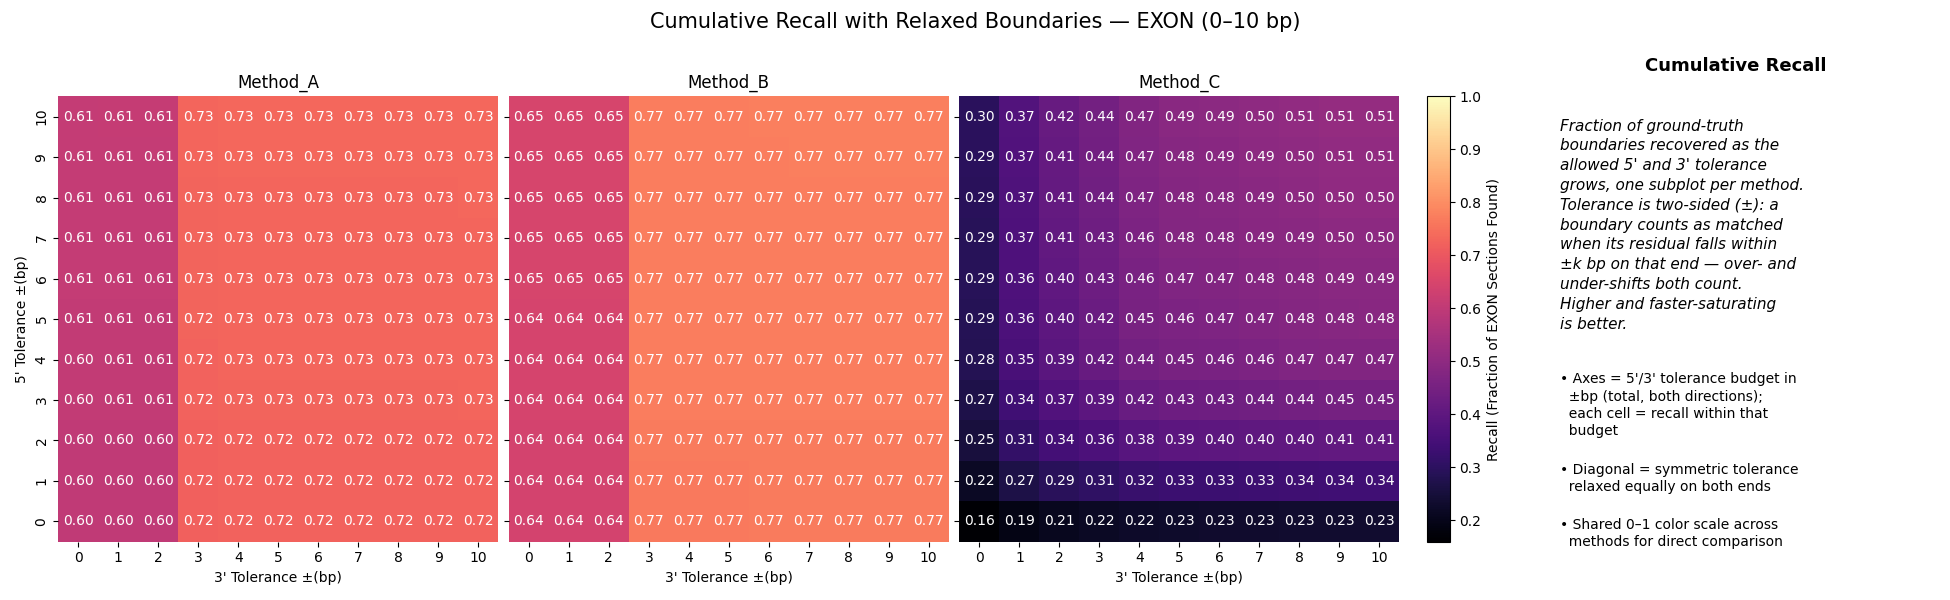
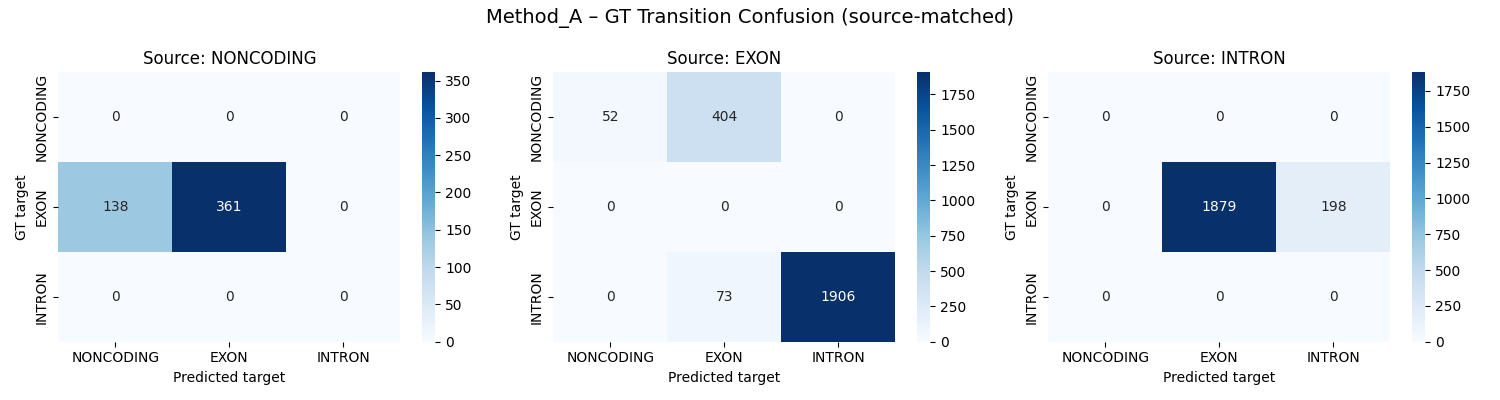
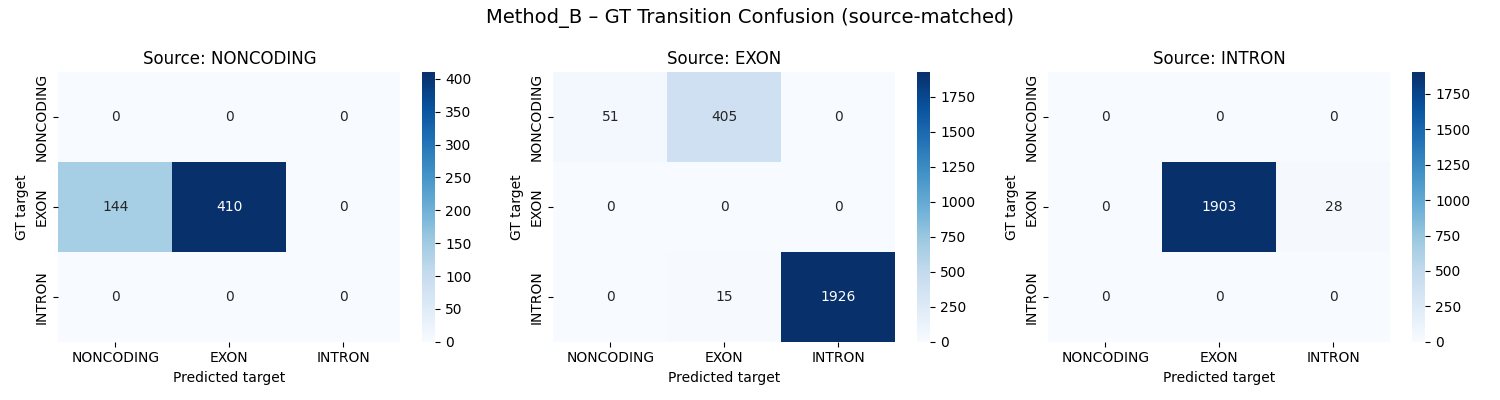
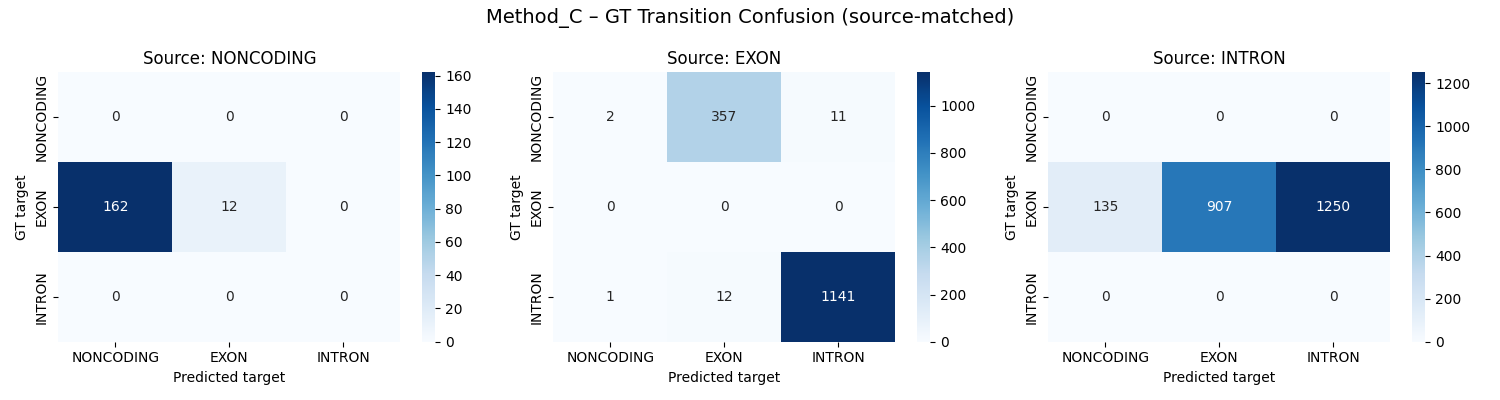
The comparison bundle includes boundary landscape plots (one subplot per method, grouped by metric for side-by-side comparison), plus per-method position bias and transition matrices.
Boundary bias and cumulative recall:
Transition matrices:
Interpretation
This plotting layer is comparative, not evaluative on its own. Use the Metrics pages to interpret what each figure means.