Boundary Exactness
Boundary Exactness measures how far predicted coding sections deviate from GT boundaries once there is some overlap.
What Is Computed
For every greedy 1:1-matched (GT, pred) coding section pair (the same matched
pairs used by Region Discovery — best-overlap-first, each GT and prediction
claimed at most once), the benchmark records:
signed 5’ residual:
pred_start - gt_startsigned 3’ residual:
pred_end - gt_endIoU score for the overlapping pair
It also records two terminal-boundary flags:
first_sec_correct_3_prime_boundarylast_sec_correct_5_prime_boundary
These are stored per sequence in
BOUNDARY_EXACTNESS and then summarized across many sequences.
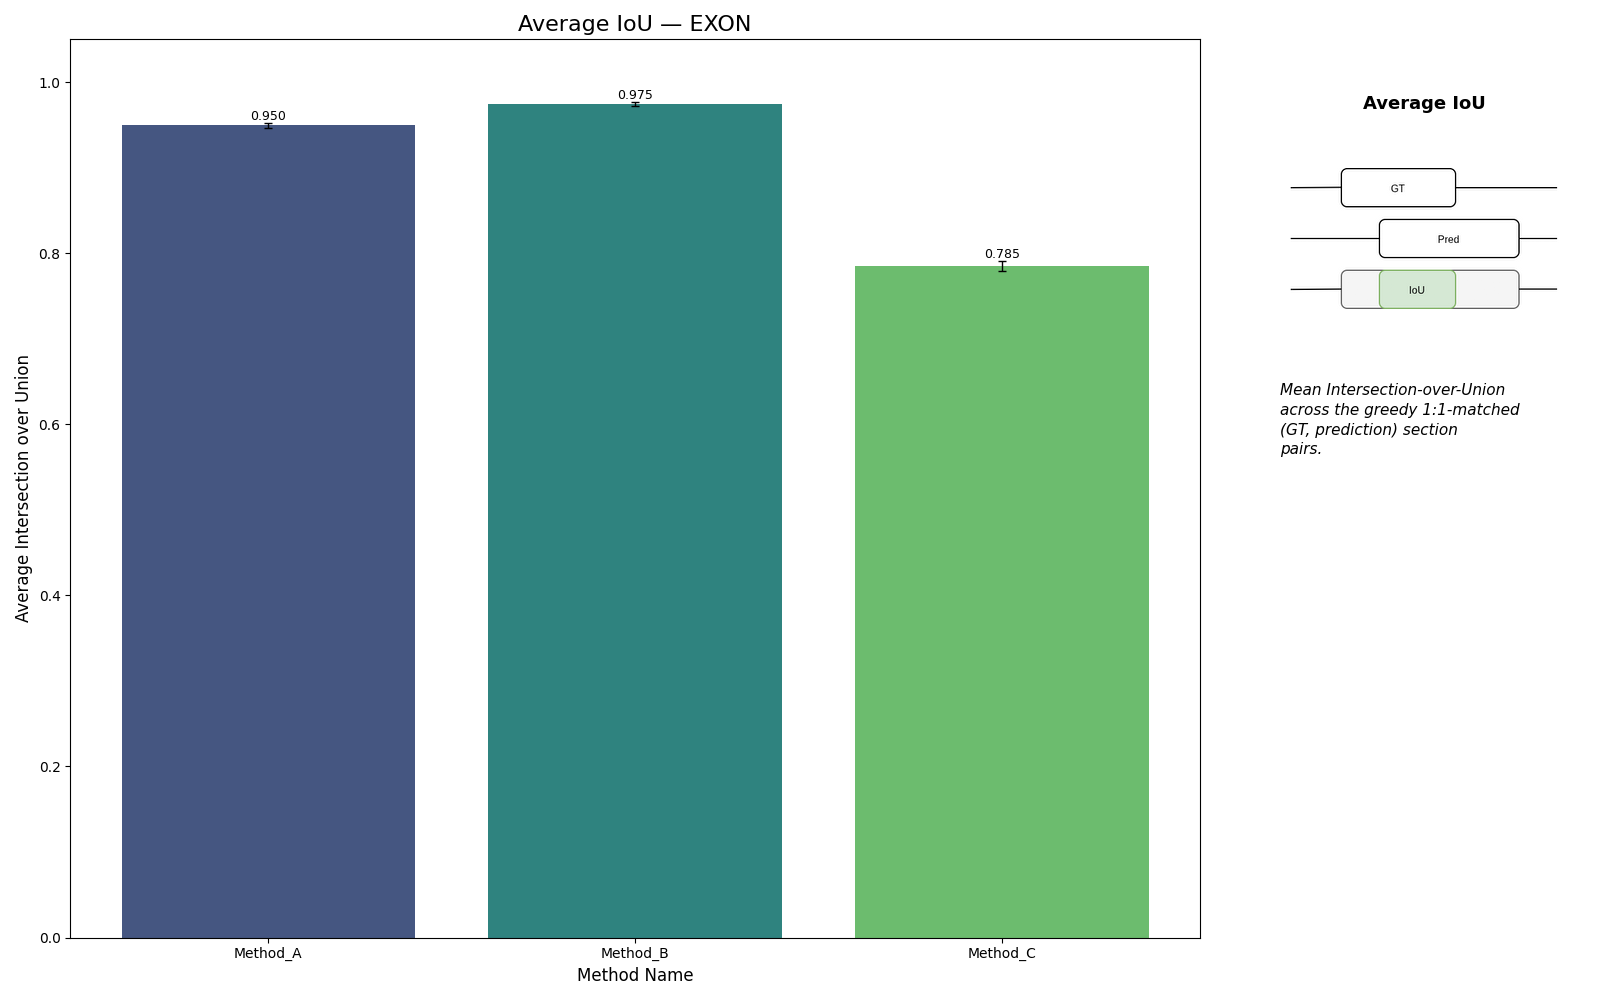
IoU
The Intersection-over-Union for a single overlapping (GT, pred) coding
section pair is computed with inclusive 0-based endpoints:
intersection = max(0, min(gt_end, pred_end) - max(gt_start, pred_start) + 1)
union        = max(gt_end, pred_end) - min(gt_start, pred_start) + 1
IoU          = intersection / union   (or 0.0 when union == 0)
The +1 terms reflect inclusive bounds — a section with start == end
has length 1, not 0. Scores produced by external tools that use
half-open intervals will differ slightly for very short sections; see
conventions.md.
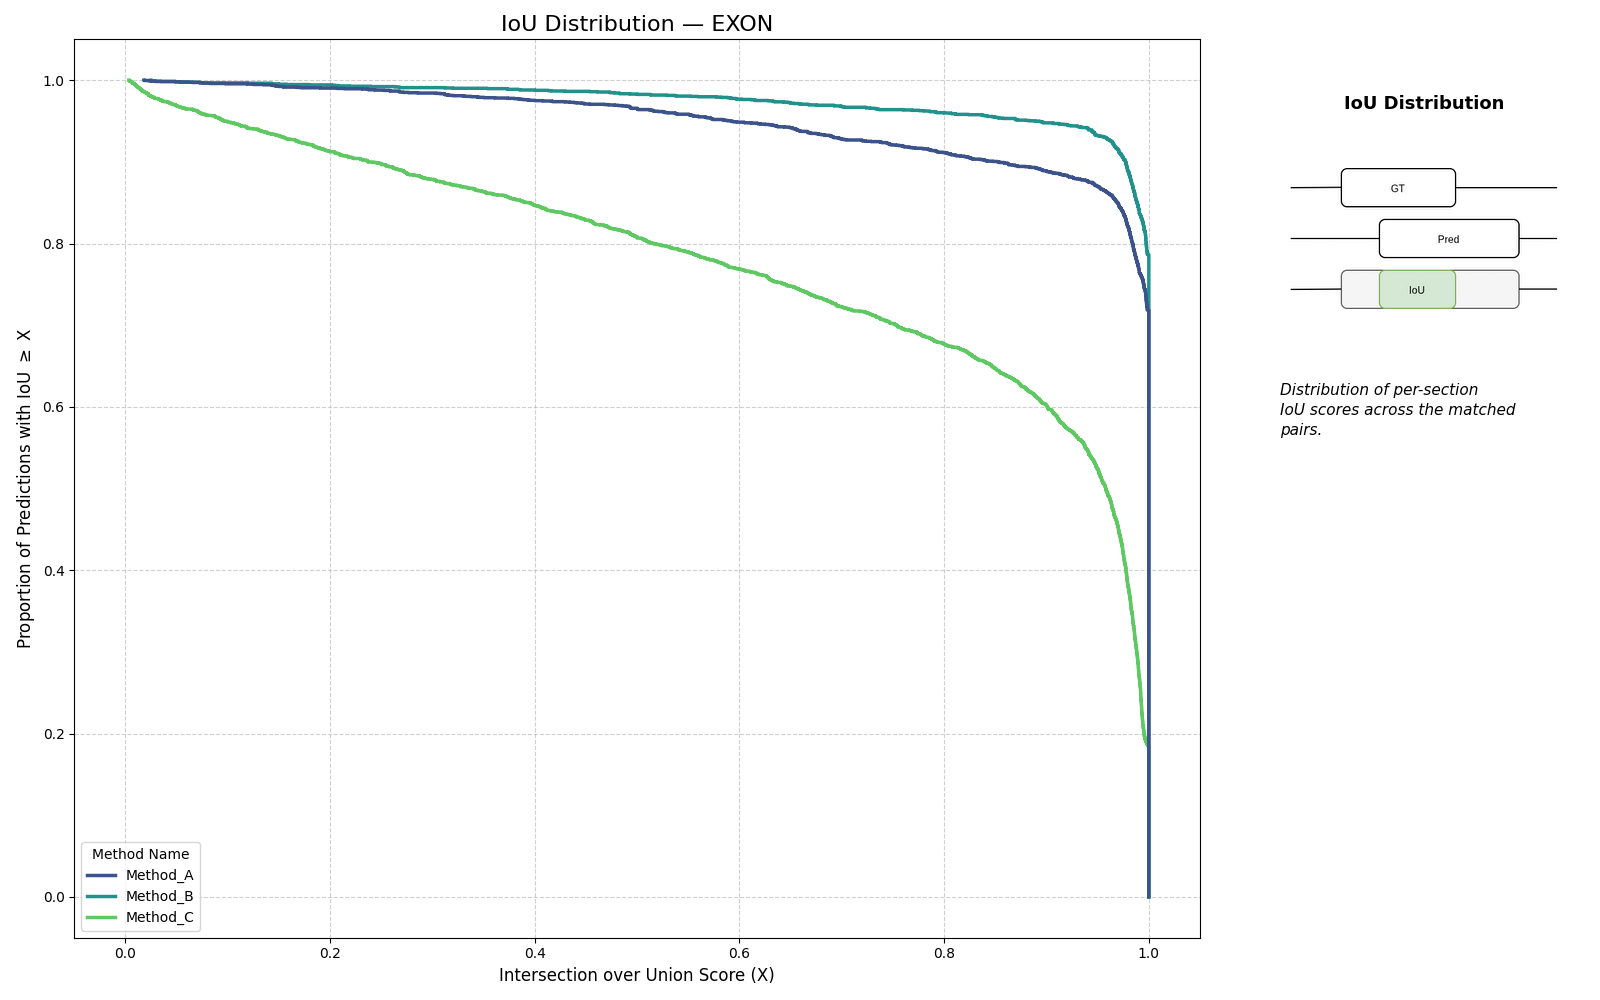
The raw iou_scores list contains one IoU value per greedy 1:1-matched
(GT, pred) pair. After aggregation, iou_stats["mean"] is the scalar
used by the W&B online logger.
Boundary Bias and Cumulative Recall
Two shapes of
fuzzy_metrics. In the raw, un-aggregated per-sequence fragment,fuzzy_metricsis{"boundary_offsets": [...signed (5', 3') residual pairs...], "total_gt": int}. The aggregated report (the standard result this page describes) replacesfuzzy_metricswith the four computed keys{"max_range", "bias_matrix", "reliability_matrix", "sidedness"}— it does not carryboundary_offsets. Bothbias_matrixandreliability_matrixare nested lists with rows = 5’ dimension, columns = 3’ dimension; the tick labels are derived frommax_range(bias axis-max_range..max_range, tolerance axis0..max_range).
The raw per-sequence boundary_offsets list contains all signed residual pairs
from overlapping sections. Aggregation turns that into two diagnostics, each
rendered as a grid of small multiples — one subplot per method — so predictions
can be compared side by side against the same ground truth:
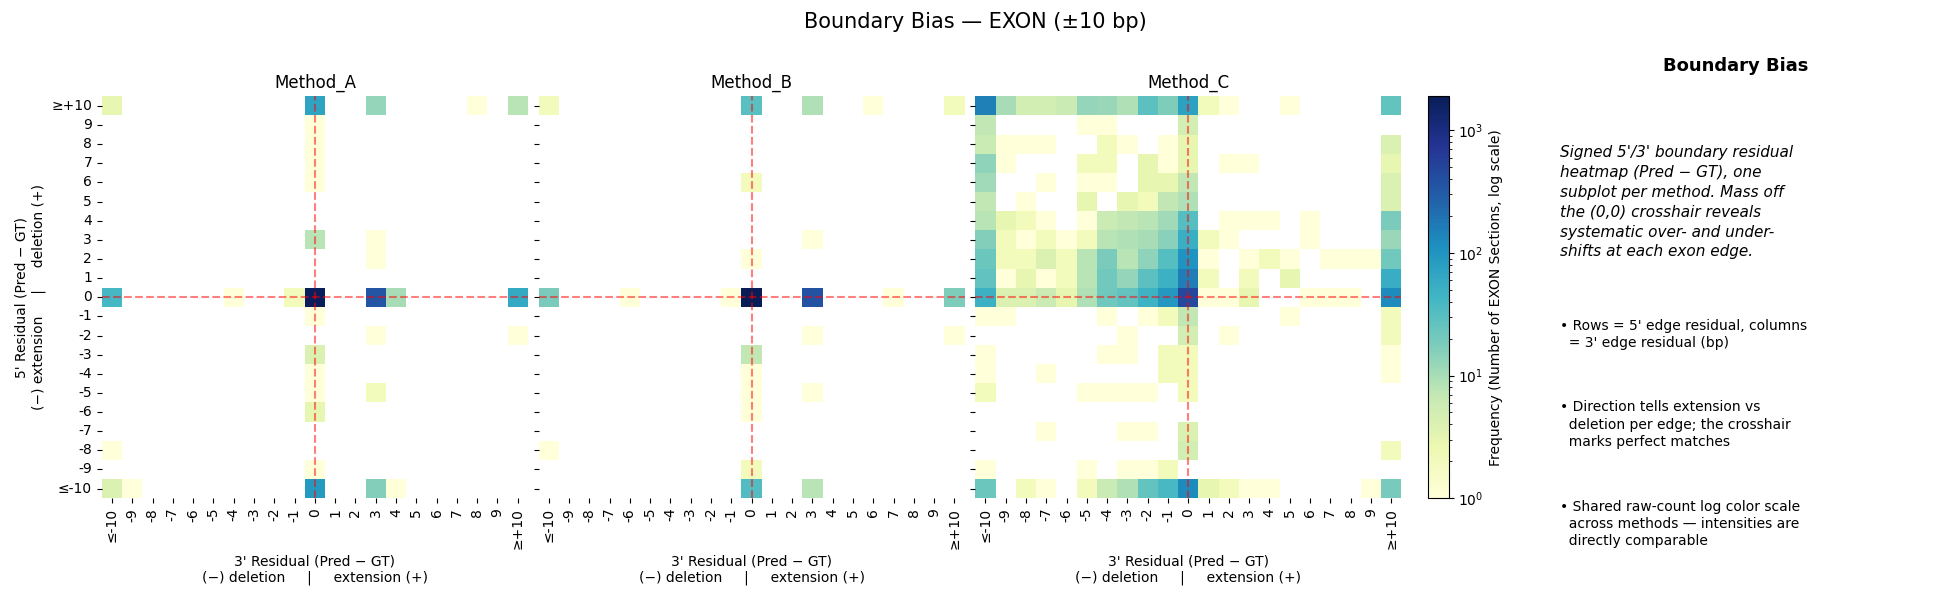
Boundary bias — a signed 5’/3’ residual heatmap showing whether certain boundaries are consistently over- or under-predicted. All methods share one raw-count, log-scaled color norm, since the
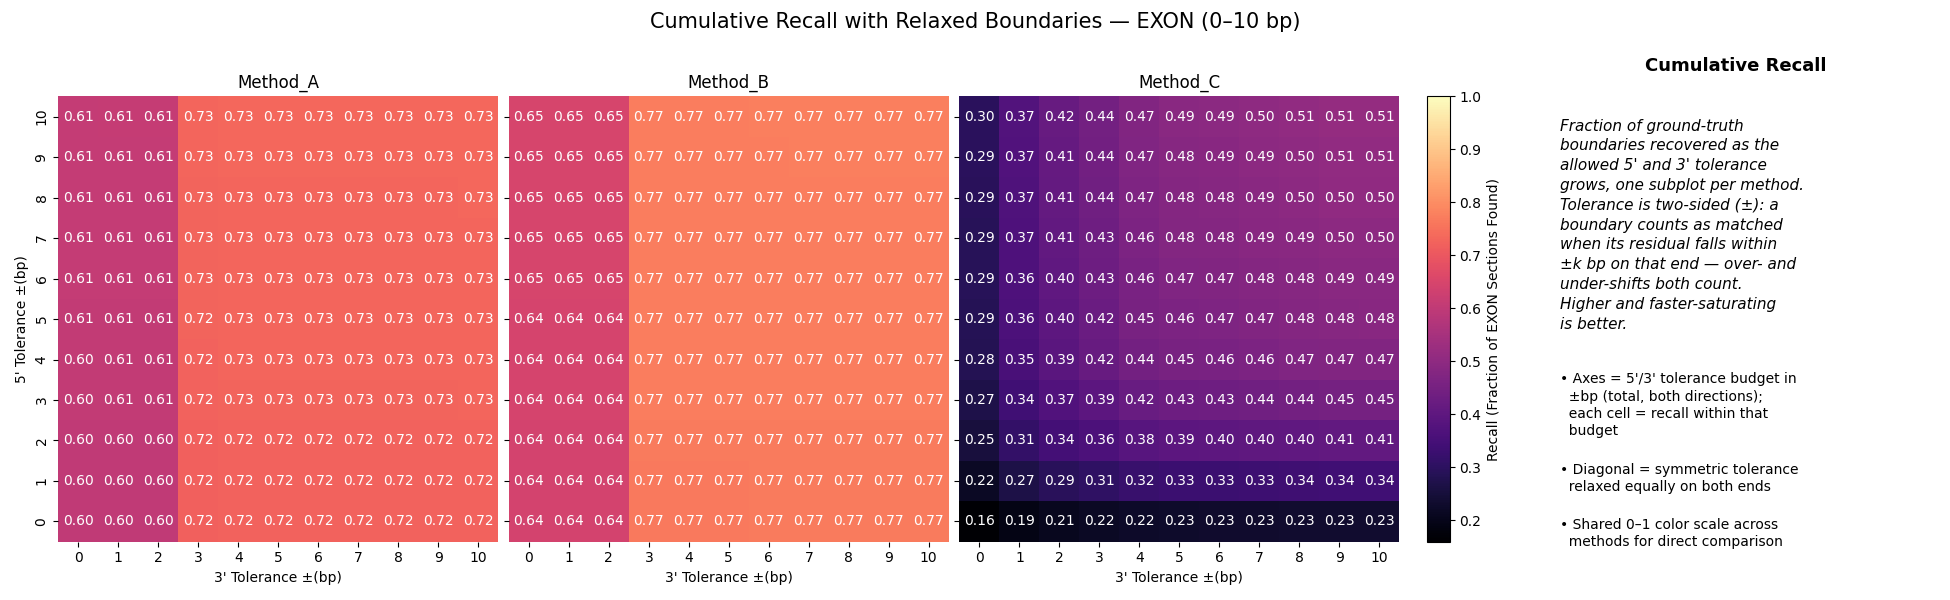
(0, 0)exact-match cell otherwise dominates the count and hides the (much rarer) off-center error structure. Cells with zero observations are left blank rather than colored as the low end of the scale. Residuals beyond±max_rangeare clipped into the two extreme rows/columns (labeled≤-max_range/≥+max_range), so those edge cells are saturation buckets, not exact±max_rangevalues — every matched pair is retained rather than silently dropped, keeping the one-sidedness read comparable across callers with different tail weights.Cumulative recall with relaxed boundaries — how recall improves when each boundary is counted as a match given a tolerance budget on the 5’ and 3’ end. The tolerance is two-sided (±): a boundary matches when its residual falls within ±x bp on that end, so over- and under-shifts both count. All methods share a common
0–1scale.
Interpretation:
values centered near
(0, 0): boundaries are usually exactmass shifted to negative 5’ residuals: predictions start too early
mass shifted to positive 3’ residuals: predictions end too late
One-Sidedness Decomposition
Aggregation also emits a clip-free scalar summary under
fuzzy_metrics["sidedness"], computed from the raw residuals (not the
clipped bias matrix). Of all matched pairs it splits the boundary errors into
those that miss exactly one edge versus both:
total,exact— matched-pair count and how many hit both boundaries dead-onone_sided/two_sided— pairs where only one / both of the 5’ and 3’ edges are off, withone_sided_fractiontaken over the errored pairs (one_sided + two_sided; the two-sided fraction is its complement)clipped_from_bias_matrix— audit count of pairs whose|residual|exceededmax_rangeon either edge (the mass the bias heatmap saturated into its edge buckets)
Because it is read off the raw residuals, this fraction is comparable across callers regardless of how heavy their offset tails are.
Terminal Boundary Flags
Two binary flags isolate the splice sites adjacent to the terminal coding sections:
first_sec_correct_3_prime_boundary— 1 iff some prediction’s downstream end matches the first GT coding section’s downstream end. For a multi-exon transcript this is the inner (3’-side) splice site of the leading exon — i.e. the boundary between the first exon and the first intron.last_sec_correct_5_prime_boundary— 1 iff some prediction’s upstream start matches the last GT coding section’s upstream start. This is the inner (5’-side) splice site of the trailing exon.
These are not the outer transcript termini; they target the splice junctions that are most often hardest to nail when a model otherwise finds the right gene locus.
The flag names use array-orientation (5’ = lower array index, 3’ =
higher array index). They do not encode biological strand — on the
minus strand the array-5’ end corresponds to the biological 3’ end of
the transcript. See conventions.md for the full convention.
Caveats
Only overlapping section pairs contribute. Completely missed GT sections do not add IoU or residuals directly; they matter through Region Discovery.
Each GT section contributes at most one residual pair: the greedy 1:1 match claims each GT and prediction once, so a prediction overlapping several GT sections no longer inflates the bias/reliability landscape.
IoU mean is informative, but it hides whether errors are a few large misses or many small offsets. Use it together with the distribution plot.
The bias-landscape histogram is bounded to
±max_range(default 10 bp). Residuals beyond that range are clipped into the edge buckets (not dropped), so the matrix still counts every matched pair; the exact out-of-window offset is recoverable only from the rawboundary_offsetsand thesidedness["clipped_from_bias_matrix"]audit count. They also contribute to the cumulative-recall surface, which is computed clip-free.See Conventions for the inclusive-endpoint rule that governs IoU and the array-orientation rule that governs the 5’/3’ field names.