Nucleotide Classification
Nucleotide Classification is the simplest metric family in the benchmark: it collapses the task to in-scope vs everything else and reports binary classification quality per base.
Example Plot
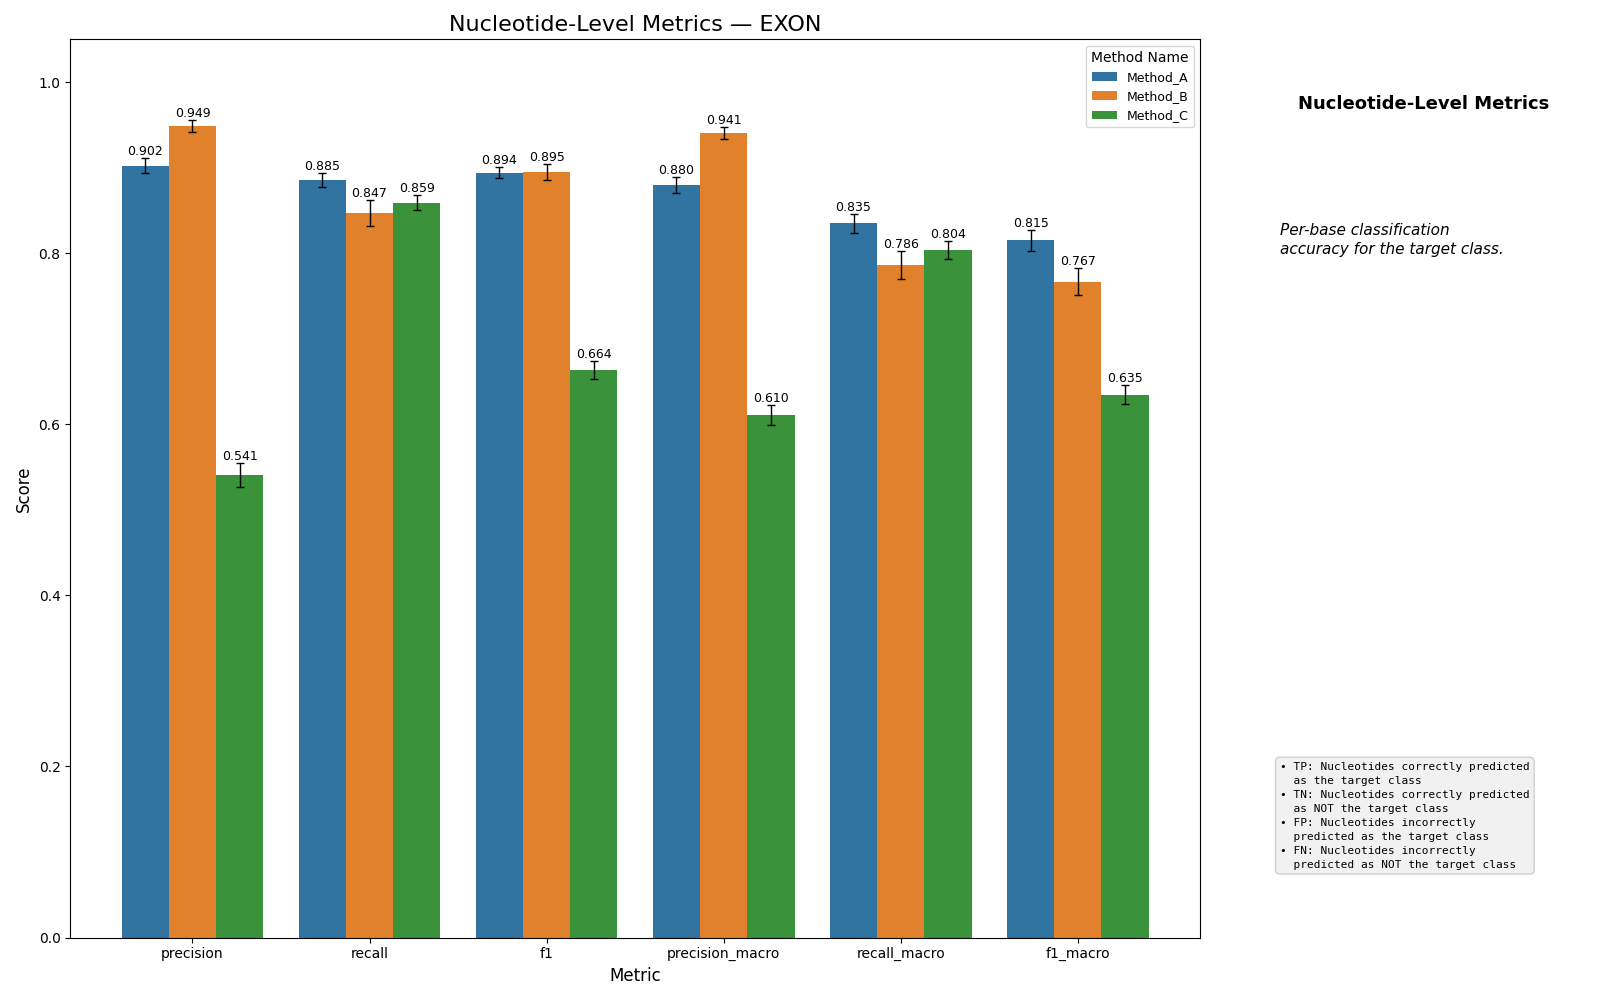
What It Computes
The benchmark binarizes both arrays using the configured evaluation_scope
(see Annotation Modes):
positions whose label is in the scope’s positive-token set become
1(exoninEXON_INTRON;5' UTR + CDS + 3' UTRfor thetranscript_exonscope, orCDSonly for thecdsscope inUTR_CDS_INTRON)every other label becomes
0
It then computes a 2x2 confusion matrix and aggregates:
precision
recall
F1
The raw counts are tn, fp, fn, and tp. Those are converted to
user-facing summary statistics during aggregation.
Interpretation
This family is useful when you care about in-scope occupancy more than exact structure.
high values here and weak structural metrics: the model often paints in-scope nucleotides in roughly the right places, but gets segmentation wrong
low values here and weak structural metrics: the model is missing in-scope content entirely or hallucinating it broadly
Caveats
This is not a multi-class confusion metric across all labels. It is in-scope vs out-of-scope.
It is easier to optimize than section-level and transcript-level metrics. Good nucleotide F1 does not imply good transcript structure.
For splice-site-heavy label sets, this family hides whether mistakes come from exon/intron confusion or splice-label confusion, because everything outside the scope is folded into the negative class.
Aggregation is micro-averaged across sequences: per-sequence
tp,fp,fn,tnare summed before the ratio is taken, so longer sequences dominate the corpus score. See Conventions for details.The scope’s positive-token set is always non-empty, so the metric always produces a
nucleotideconfusion block when requested.