Diagnostic Depth
Diagnostic Depth (EvalMetrics.DIAGNOSTIC_DEPTH) adds distribution-level and
positional diagnostics that complement the per-section metrics. It answers
where and by how much a prediction’s structure diverges from the reference
— length_emd measures the magnitude of the length-distribution mismatch and
the position-bias histograms show where mismatches concentrate — rather than
scoring pass/fail. All outputs operate on the coding sections of the configured
evaluation_scope.
Example Plots
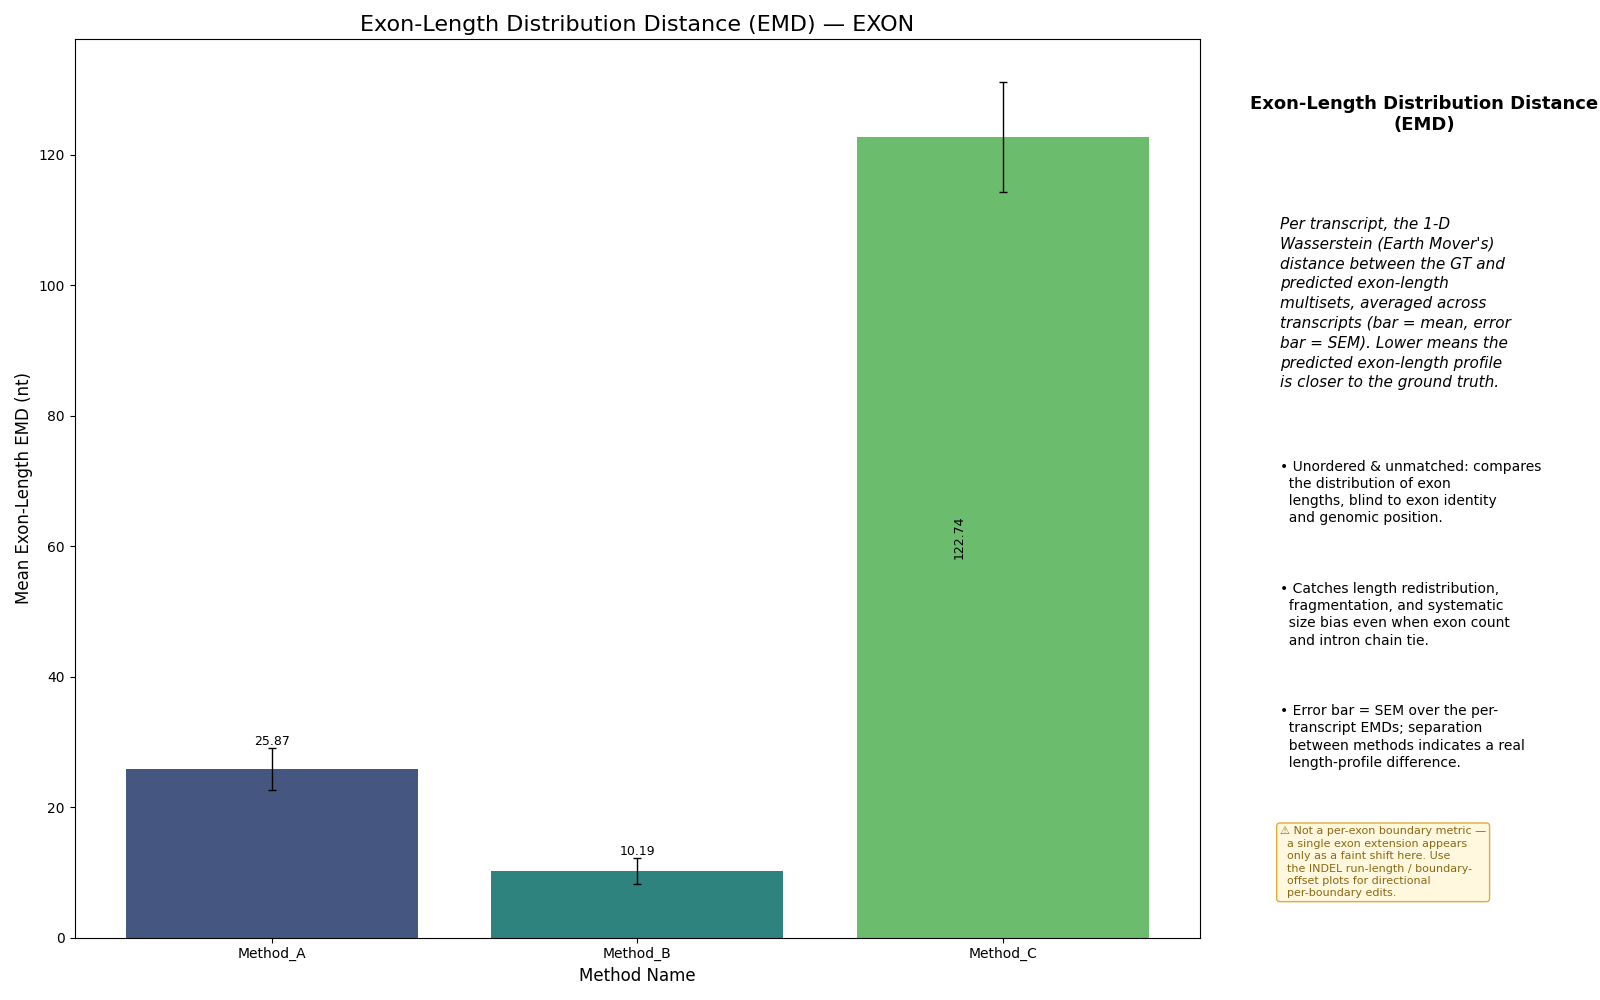
Per-method mean exon-length EMD (bar = mean, error bar = SEM across transcripts). Lower means the predicted exon-length profile is closer to the reference; the SEM whiskers show whether a gap between methods is a real separation.
What Is Computed
For each (GT, prediction) pair the benchmark records:
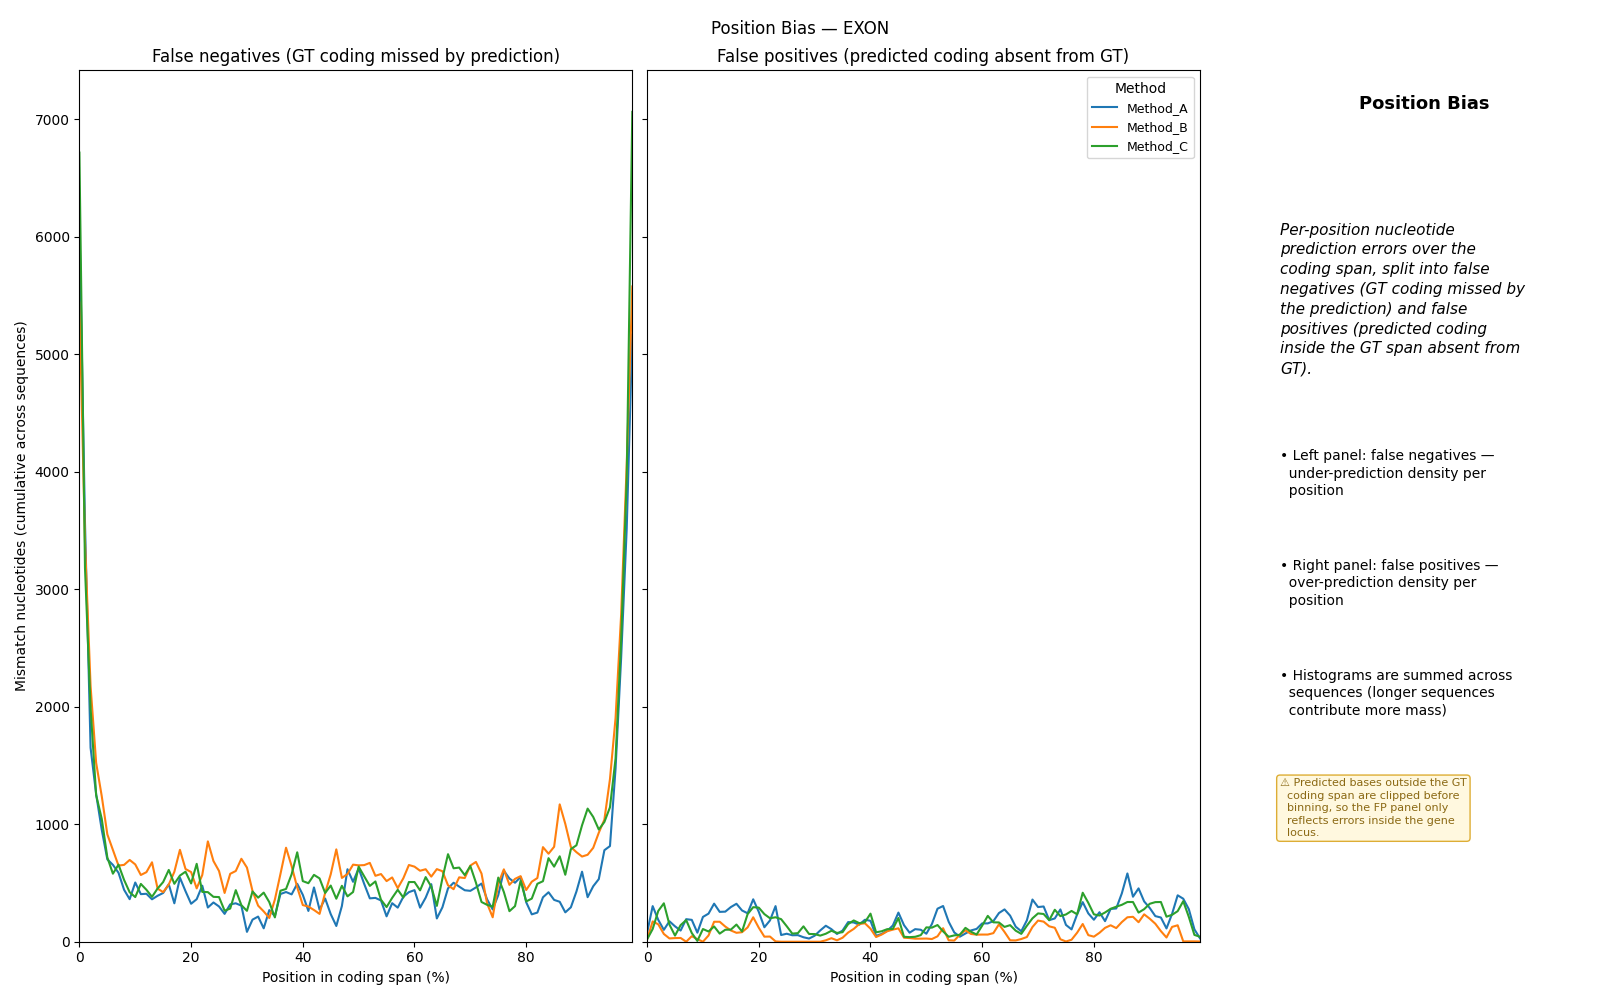
gt_segment_lengths/pred_segment_lengths— the lengths (in nucleotides) of every GT and predicted coding segment.length_emd— the 1-D Wasserstein (Earth Mover’s) distance between the GT and predicted segment-length distributions. It quantifies whether the model produces segments of the right length, independent of where they sit. It is computed per transcript and rendered as a per-method mean ± SEM bar (see the plot above).position_bias_histogram_fn/position_bias_histogram_fp— two 100-bin histograms of per-nucleotide mismatches, normalised to the GT coding span so that bin 0 is the start of the first GT coding segment and bin 99 the end of the last.
The two position-bias histograms are kept separate so under- and over-prediction can be told apart:
Histogram |
Counts |
|---|---|
|
GT coding positions not covered by the prediction (under-prediction) |
|
Predicted coding positions inside the GT coding span that are not in GT (over-prediction) |
Predicted positions outside the GT coding span are clipped out, keeping each histogram bounded to the gene locus.
Interpretation
length_emdnear 0: predicted segment lengths match the reference distribution.FN mass concentrated near bin 0 / bin 99: the prediction systematically trims the terminal coding segments.
broad FP mass: the prediction paints coding bases across the locus that the reference does not contain.
Aggregation
Across sequences, segment-length lists are concatenated and the two histograms
are summed bin-wise before any summary statistic is taken (see
Conventions). The online W&B subset logs length_emd/mean and
length_emd/mae.
Caveats
“Coding segment” is defined relative to the configured
evaluation_scopepositive-token set, so acdsrun and atranscript_exonrun produce different histograms.The histograms describe positional mismatch density, not transcript chain correctness — pair them with Structural Coherence.
length_emdis a distribution distance, not a per-exon boundary metric: it is unordered and unmatched, so a single exon extension shows only as a faint shift. Use the INDEL run-length / boundary-offset diagnostics for directional per-boundary edits.